Midas NFX: Thermal-Structural Coupled Analysis [IAD 5]

Author: Gabriel Roade
Publish Date: 27 Dec, 2021
From the series Introduction to Analysis for Designers...
5. Thermal-Structural Coupled Analysis
Generally, a structure expands or shrinks when under thermal load, caused by ambient temperature, heating or cooling. If the structure, however, is constrained to other structures around it, or if it is combined with members with different coefficients of thermal expansion, the expansion or shrinkage becomes limited and strain occurs. Due to this, the influence of heat on strength cannot be ignored for structures under significant temperature changes. For example, metal fatigue caused by thermal load can originate cracks in parts of a nuclear power plant and cause serious accidents. In a structure under such heat load, the effect of thermal stress on the design must always be understood and taken into account.
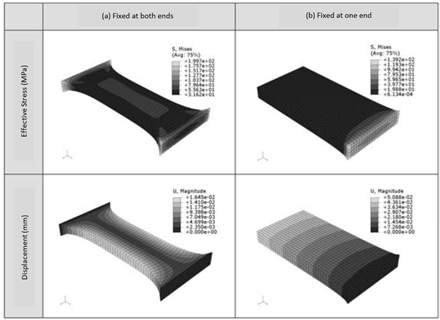
Figure 1: Thermal Stress Analysis of Flat Plate Temperature Drop (40 °C to 20 °C)
To understand the effect of temperature change on a structure, let us examine the results of the thermal stress analysis of a plate model (elastic modulus: 210 GPa, Poisson’s ratio: 0.3, thermal expansion coefficient: 12e-6). In addition, the influence of the constraints will be studied by setting both a case where the plate is fixed on both sides and another where it is only fixed on one; a case of increasing temperature, from 20 °C to 40 °C, is also studied here. Figure 1 shows the effective stress (Von Misses stresses) and displacement in the structure when temperature is lowered from 40 °C to 20 °C in a plate; Fig. 1 (a) shows the results for a plate fixed at both ends, and Fig. 1 (b) those for a plate fixed at only one end. In these results, one can appreciate that there are many regions where tensile stress is larger in case (a) than in case (b), even when the same temperature drop has been applied. In Figure 2, on the contrary, shows the results when the temperature of the plate is increased from 20 °C to 40 °C, causing the plate to want to expand but constraining it from doing so, which generates large compressive stresses.
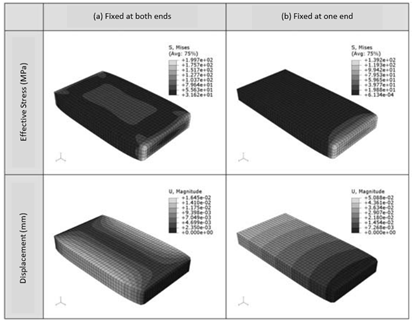
Figure 2: Thermal Stress Analysis (20 °C to 40 °C)
Thermal stress analysis generally follows a straightforward process: the temperature distribution of the object is calculated first, and then the results of this analysis are used as thermal load in structural analysis. Thermal stress basically calculates the compression or shrinkage of an object due to temperature changes. When the temperature distributions before and after heat input or discharge are calculated, the strain due to these phenomena can be calculated from their difference.
This method can be applied only under “weak ductility” conditions; that is, when the deformation of the structure due to temperature changes does not greatly affect the temperature distribution. For example, if a heat fluid flows around a complex shape, the heat flow may change due to thermal deformation, which may change the effect of the heat acting on the structure; “weak ductility” cannot be applied to this case. In the case where fluid calculation is not carried out, this method can be used with no problem, and since it is relatively easy to set up, it is the most widely used for these cases.
However, in the case where heat flow greatly varies due to thermal deformation, it is preferable to use a method called “lubrication property”. In this case, it takes longer to calculate both the temperature distribution and the thermal deformation, since they will be simultaneously changing in correlation.
Thermal analysis and structural analysis are coupled to each other in the manner shown in Fig. 3. ①, ②, ⑤, ⑦, ⑧ are steps already included in structural analysis; ③, ④ and ⑥ are the added steps, aimed to reading temperature distribution results and translating them into boundary conditions. Among them, step ③ has the greatest influence in the computation, since it comprises the setting of thermal boundary conditions.
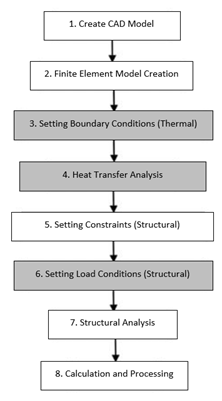
Figure 3: Order of Thermal Stress Analysis by the Weak Ductility Method
Thermal boundary conditions refer to the heat exchange conditions between the surface and the exterior of the object to be analyzed. They comprise heat flux, heat transfer rate, constant temperature and heat insulation conditions, as shown in Table 1. Heat flux refers to the amount of heat transferred per unit area, and a constant heat flux always flows in and out of a surface regardless of the temperature of the object. It is easy to understand when considering the state of contact with an element of which we know the amount of heat generated by it per unit time. Heat transfer rate is a term that defines the change of heat flux entering and exiting a surface due to the difference in temperature between the object and the external environment. Heat flux () is mathematically defined as:

T is the surface temperature of the object, T∞ is the outside temperature, A is the surface area, and α is the heat transfer coefficient. When the outside temperature, for example, is lower than the initial surface temperature, becomes negative, meaning the heat is discharged from the object. By setting the value appropriately, it is possible to calculate the temperature distribution of the object under various external conditions. If the surrounding environment is a fluid, varies depending on the physical properties of the fluid and the flow conditions (laminar/turbulent). Moreover, if there are other structures in the space around the object of analysis, strictly speaking, heat radiation between objects should be considered. However, if the surrounding structures are at the same temperature as the object, radiation heat is almost negligible.
A constant temperature boundary condition means that the heat flux flows in or out of the surface in such a way that the surface is always fixed at a constant arbitrary temperature. Finally, heat insulation refers to the condition in which there is no heat transfer with the outside. Generally, in the calculation of heat conduction by finite element method, the heat insulation is automatically set unless some other thermal boundary condition is specified. Therefore, it is necessary to be careful not to forget setting the appropriate boundary conditions.

In the case of heat conduction calculation, it is necessary to set any of the four thermal boundary conditions mentioned above on the surfaces of the object analyzed. It should be noted here that thermal equilibrium of the entire analytical system should be achieved in steady state; if there is heat or a heat-generating surface, there must also be a surface where the same heat flows out. In other words, the total amount of heat flowing into the object must equal the total amount of heat flowing out of the object.
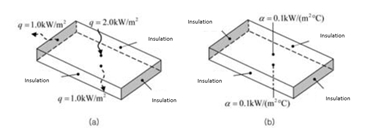
Figure 4: Examples of Problematic Boundary Conditions
For example, let’s consider the thermal boundary conditions shown in Fig. 4 (a). A heat flux of 2.0 kW/m2 flows into the upper surface, and a heat flux of 1.0 kW/m2 flows out from the lower surface, and from one of the side surfaces as well. In this case, the amount of heat input from the upper surface (the product of the heat flux and the surface area) is greater than the total heat released from the side and lower surfaces. Therefore, the temperature on the plate continues to rise and steady state cannot be reached, making the calculation unable to converge. In Fig. 4 (b), since the initial temperature is set to be the same as the ambient temperature, it is meaningless to calculate the temperature distribution.
It is also necessary to pay attention to the use of constant temperature conditions because heat flux is adjusted irrespective of external conditions to maintain this condition. It is better not to use it unless one understands the qualitative temperature distribution, or in the case where the surface temperature is clear. For example, assume that the temperature distribution at a certain point in a structure that receives periodic heat loads is to be in steady state condition. Particularly, when the heat transfer rate is small and the period of change of heat flow is short, a small increase in the surface temperature may cause a large change in the heat flux, and the set temperature may never be reached. Even in this case, however, constant temperature boundary condition is not preferable.
Let’s now take a look at the results of the analysis of the same plate model used in Fig. 1 and Fig. 2, but using two or three of the four thermal boundary conditions mentioned; these results are shown in Fig. 5. In all the cases, the constraints of the structural analysis were that both longitudinal sections were completely fixed and that the initial temperature was 20 °C.
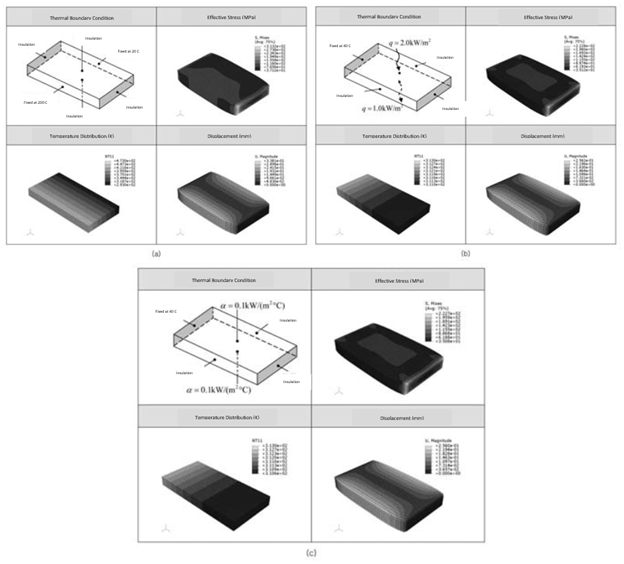
Figure 5: Examples of Analysis Under Various Thermal Boundary Conditions
Fig. 5 (a) shows the two sides parallel to the longitudinal direction as fixed at 200 °C and 20 °C, and the other faces as insulated. In this case, the same temperature gradient occurs along the width direction of the flat plate. When displacement is examined, it can also be seen that the vicinity of the plane set at 200 °C is greatly expanded, and that stress concentrates at the four corners of the fixed surface.
In Fig. 5 (b) and (c), one side is fixed at 40 °C and the heat flux, or heat transfer rate, is set on the upper and lower faces. In (b), heat is forcibly drained from the upper and lower surfaces, and a temperature gradient occurs in the longitudinal direction. In (c), the heat transfer rates on the top and bottom surfaces are specified, but, since the fixed temperature is higher than the ambient temperature, heat is transferred longitudinally and released from the top and bottom surfaces. Therefore, although the boundary conditions set in (b) and (c) are different, the qualitative tendency of heat transfer is very similar, making temperature distribution, displacement and thermal stress behave the same way in both cases. It is also desirable to remember that the temperature gradient is not likely to occur in a direction perpendicular to the short side surface near the short side, as can be seen from the temperature distribution results. In particular, this model has a temperature gradient only in the longitudinal direction because all the longitudinal surfaces are insulated.
Conduct your analysis for FREE!
| |
Speaker : Gabriel Roade Category : Mechanical Software : midas MeshFree Date : 2018-10-22 |


Add a Comment