Author: Seungwoo Lee, Ph.D., P.E., S.E.
Publish Date: 9 Jun, 2022
Creep Analysis 6
In their paper, Dr. Elbadry et al. explained how to calculate long-term effects using conventional programs (Analysis of time-dependent effects in concrete structures using traditional linear computer programs, Canadian Journal of Civil Engineering, February 2001.). In this paper, Dr. Elbadry et al. modeled post-tensioning tendons with truss elements. A very detailed explanation is discussed in the paper, and the readers should not have any difficulty understanding the methodology. (Refer to MIDAS file ex6.5)
In this article, the author will try to solve the same program only with beam elements to better understand the long-term behavior. (Refer to MIDAS file ex6.5 transformed section)
(1) Dead Load
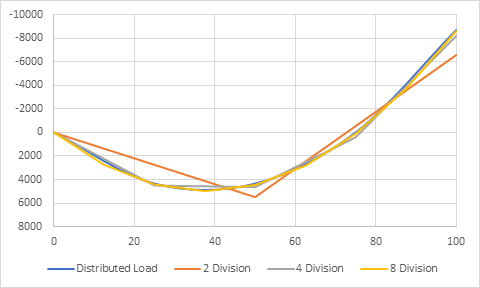
The dead load can be modeled either by distributed loads or point loads. The formed would give more accurate results, but the difference is nominal if we model the structures with a reasonable number of divisions.
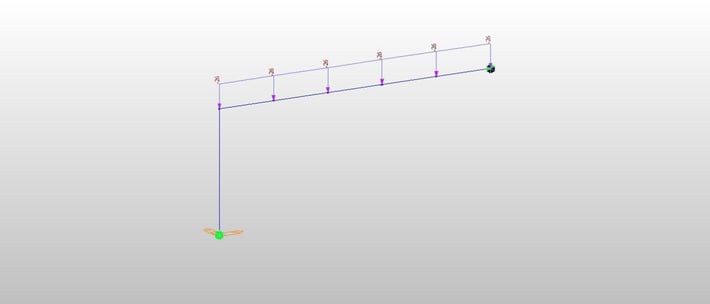
Fig 1 Dead Load
(2) Post-tensioning
Post-tensioning also can be modeled either by distributed loads or concentrated loads. From T.Y. Lin’s balanced load theorem,
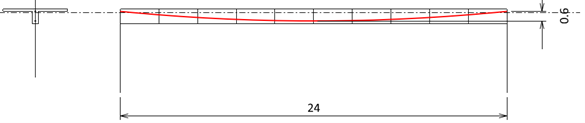
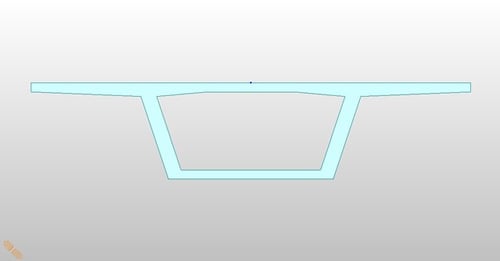
Fig 2 Tendon Profile
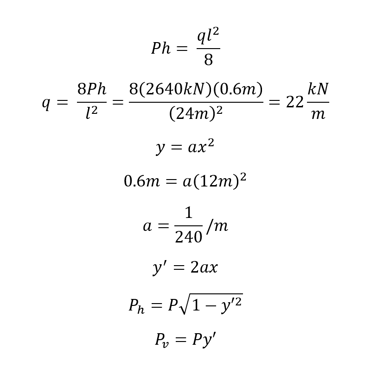
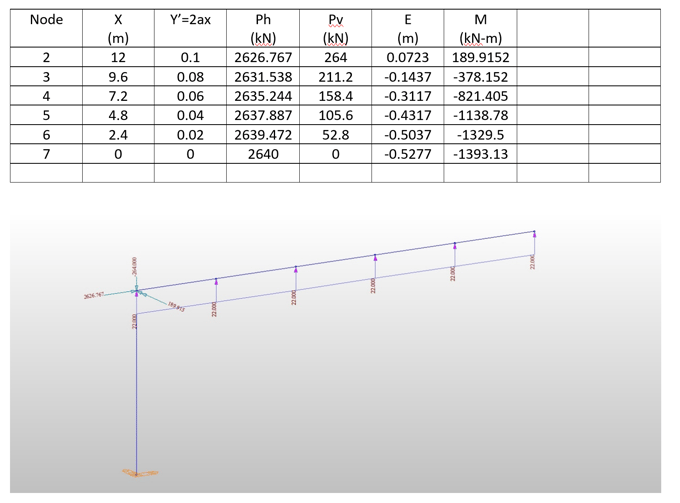
Fig 3 Post-tensioning
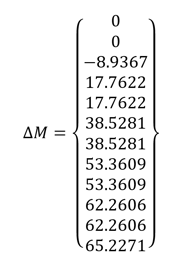
(3) DL+PS Results
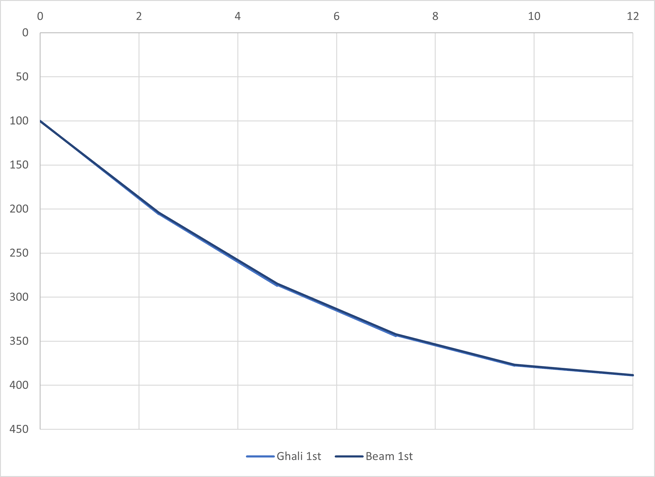
Fig 4 DL+PS Moment (kN-m)
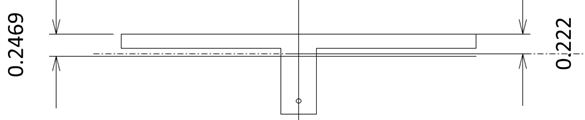
Fig 5 Neutral axis location
There are also additional moments at time t1 because the neutral axis would go down. At frame center, this additional moment is (2651.9 kN)(0.2469m – 0.222m) = 65.2271 kN-m.
(4) Creep
Show only for moment, axial and shear are similar.
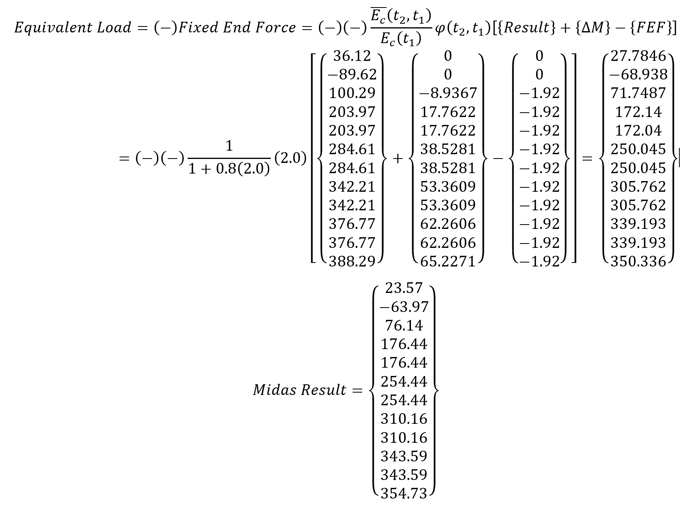
These moments are for the composite sections. For the direct comparison with the results from with truss model, only the moments supported by the concrete section need to be calculated.
(5) Transformed section
For the center section,
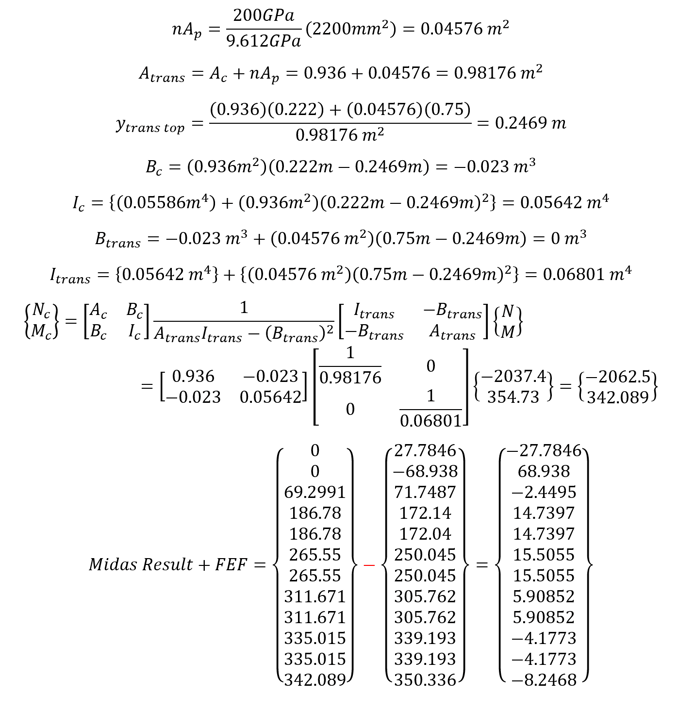
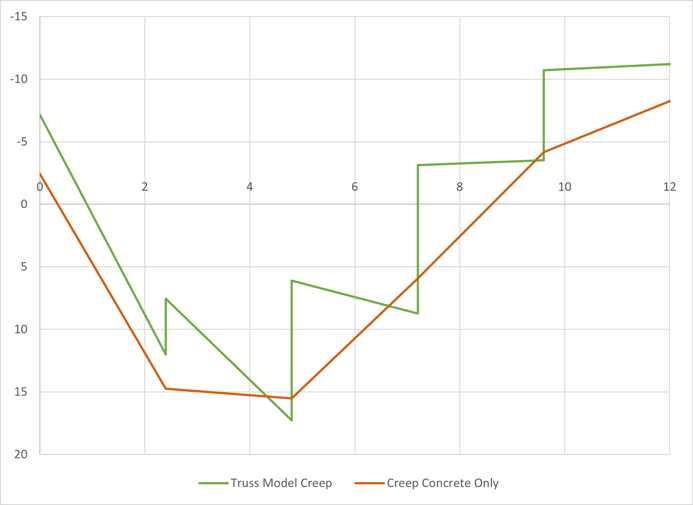
Fig 6 Creep moment for concrete section
In the model with a truss, the total moment is calculated by adding truss force to the beam moment. The total creep moment is negligible, and only the comparison graph is shown.
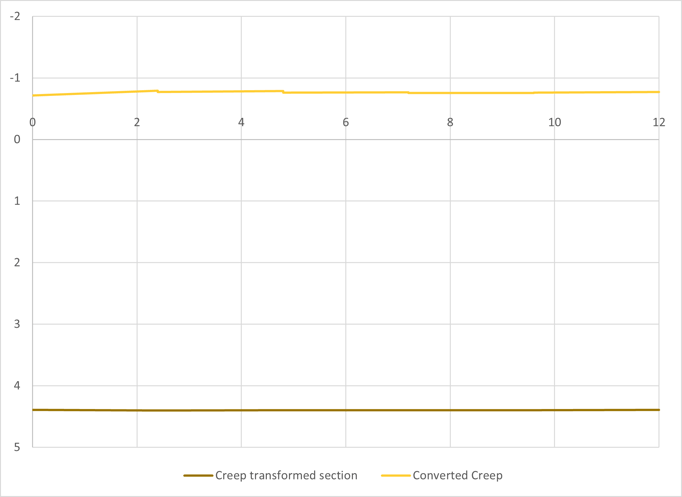
Fig 7 Creep moment for transformed section
(6) Shrinkage
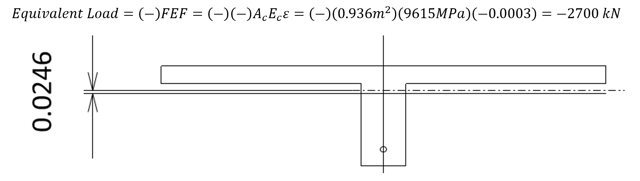
Fig 8 Neutral axis change
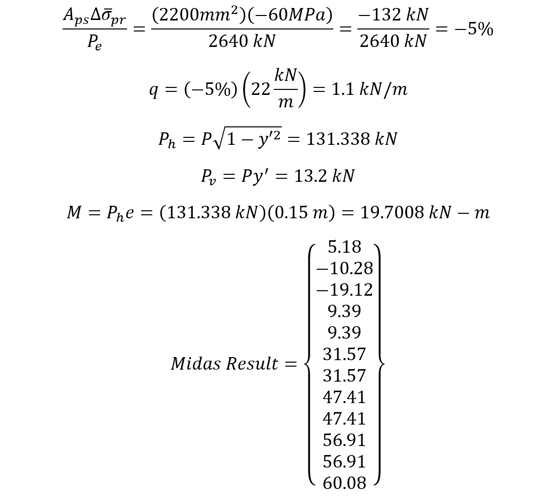
This shrinkage force is applied at the center of the concrete section, and the moments at the span center due to this eccentricity are (2700kN)(0.0246m) = 66.4097 kN-m.
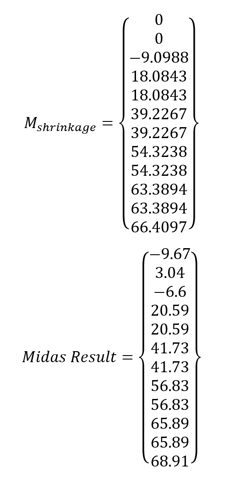
These moments are for the composite sections. For the direct comparison with the results from with truss model, only the moments supported by the concrete section need to be calculated.
For the center section,
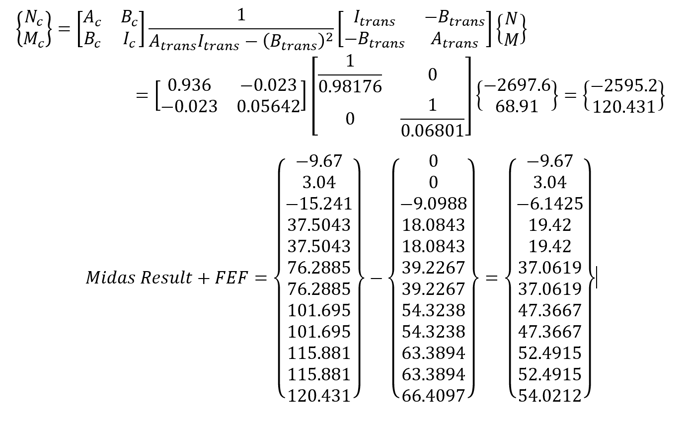
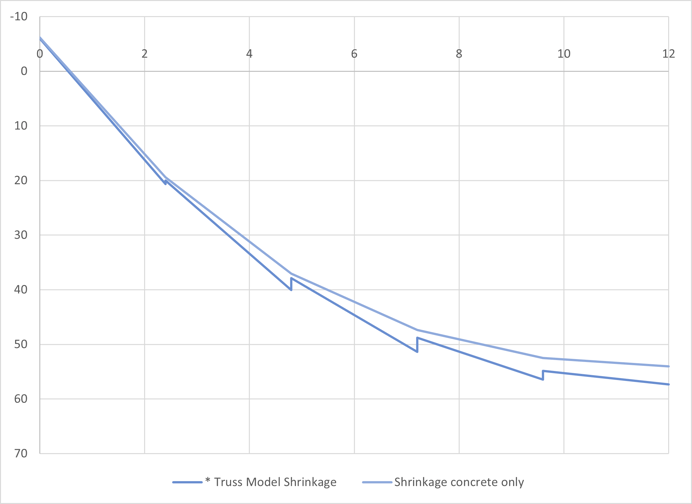
Fig 9 Shrinkage moment for concrete section
In the model with a truss, the total moment is calculated by adding truss force to the beam moment. The total shrinkage moment is negligible, and only the comparison graph is shown.
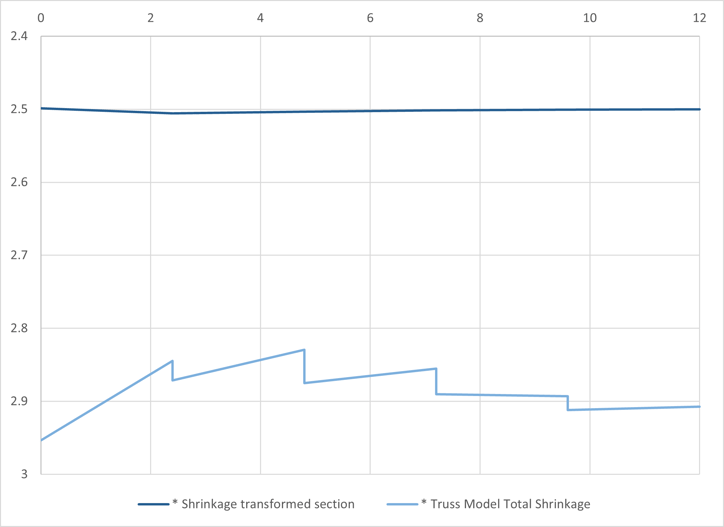
Fig 10 Shrinkage moment for transformed section
(7) Relaxation
These moments are for the composite sections. For the direct comparison with the results from with truss model, only the moments supported by the concrete section need to be calculated.
For the center section,
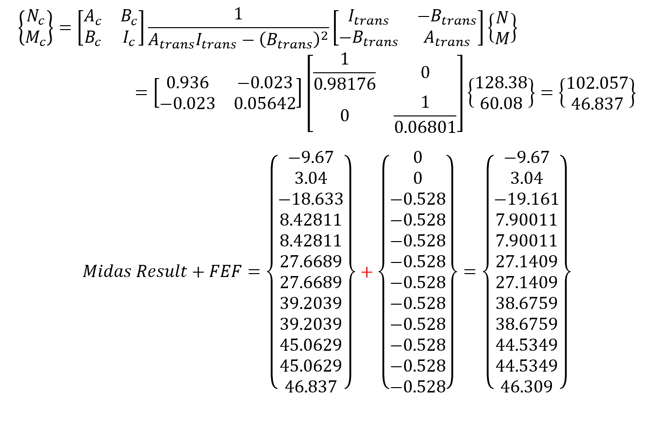
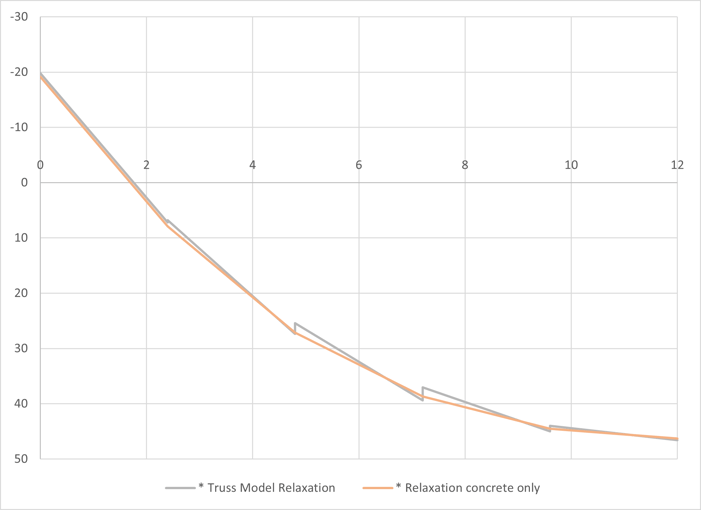
Fig 11 Relaxation moment for concrete section
(8) Comparison
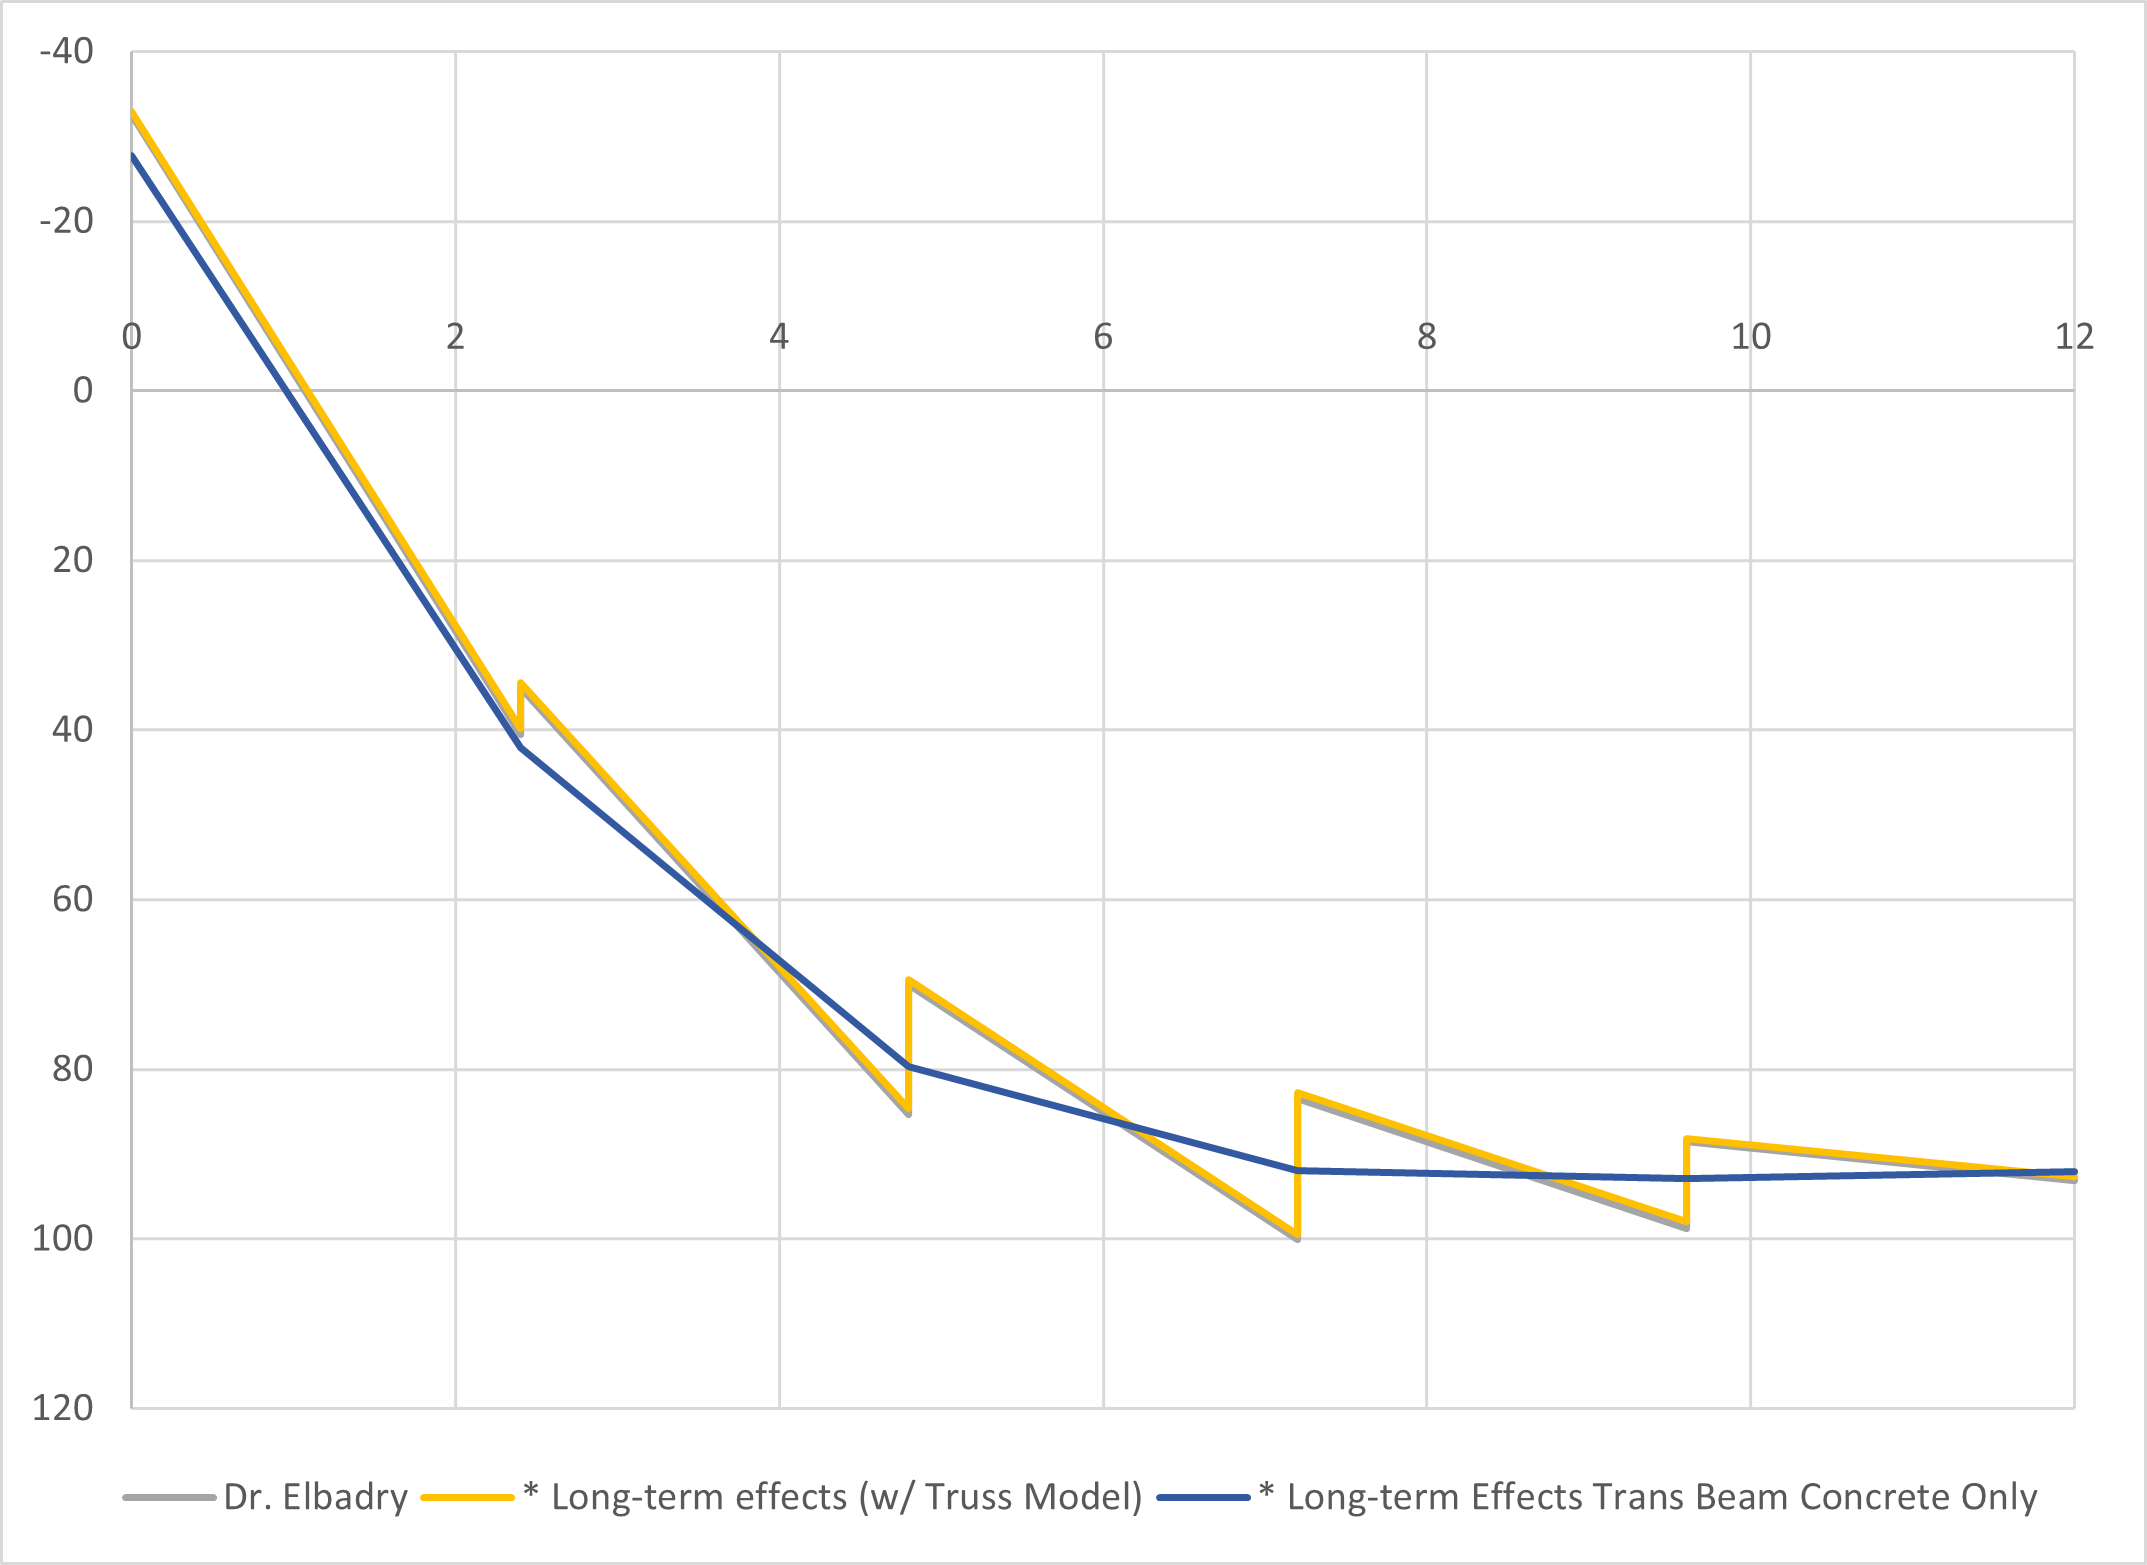
The total long-term effects of each method are shown. As can be seen, they are very well matched.
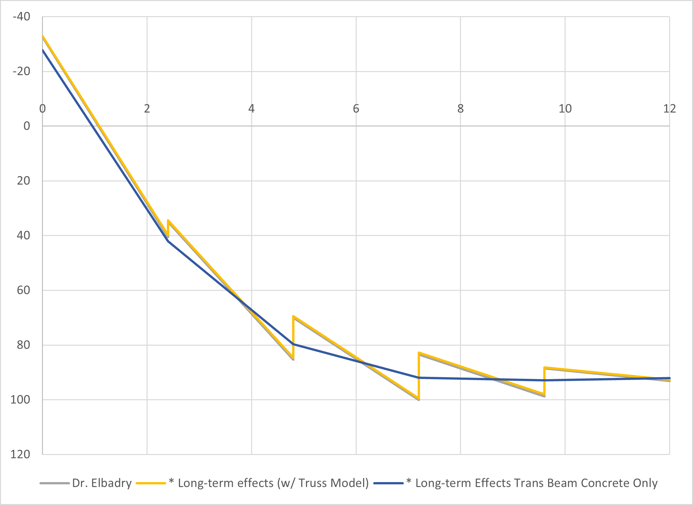
Fig 12 Long-term effects comparison
(9) Conclusion
Both methods give close results, and we can apply either one to our design. The author’s personal preference is the simpler one, a beam model because it is easier to check the model. The accuracy of long-term effect analysis depends on the number of element divisions. Some level of element division is essential if the moment curve is not linear within an element. The author’s recommendation is five to ten divisions between supports. Long-term effect analysis is an approximated analysis, and a very fine model rarely gives results with high accuracy. It is not feasible to estimate creep coefficients within 10% accuracy, and a higher level of analysis may not be justified in most cases. In other senses, the analysis algorithm needs not to be simplified because no extra efforts are required from the user’s side. The computer will do the tedious calculations for us, and we have to concentrate on understanding the basic behavior of long-term effects.


Add a Comment