Construction Stage Analysis of Composite Girder Bridges in midas Civil
Author: Xiaofeng Li
Publish Date: 4 Aug, 2021
Construction Stage Analysis - An Overview
Nowadays, bridge designers not only consider non-composite and composite action but also long-term creep and shrinkage with the effective modular ratio of n. Bridge engineers need software that automatically calculates and considers section properties in each construction sequence for accurate analysis results while the complex layout and construction stage of the bridge is analyzed with simple steps user intuitively. This article will walk you through the difference between using 3D FEA tools with construction stage analysis like midas Civil vs. simple design programs or analysis programs without construction stage analysis like MDX, STAAD Pro, LEAP Steel, LEAP Concrete, Conspan, etc.
Midas Civil provides three methods by which the initial modeling can be done. These three methods are just to consider different types of analysis cases. They do not affect the design methodology.
- Sequential Analysis + Accurate time-dependent material
- This modeling methodology is helpful when you want to have the Construction Stages along with accurate Time-Dependent Material definition.
- Sequential Analysis + Long-term Modular Ratio of 3n
- This modeling methodology is helpful when you want to have the Construction Stages analysis with time-dependent effects considered only for the composite section through the ratio of modulus of elasticity of steel and concrete.
- Composite Action w/o Sequential Analysis
- This modeling methodology is helpful when you don’t have Construction Stages defined. The long-term effect consideration in the section data using modular ratio is the same as in methodology 2.
What midas Civil considers for the Construction Stage Analysis
Time-Dependent Material Properties
- Creep effects of concrete members having different maturities
- Shrinkage effects of concrete members having different maturities
- Time-dependent compressive strength gain for concrete members
- Pre-stressing tendon relaxation
Expression of Construction Stages
- Creation (activation) and deletion (deactivation) of members with certain maturities.
- Loading (activation) and unloading (deactivation) of loads relative to time
- Change of boundary conditions relative to time
Comparison Example of Construction Stages
To compare the difference, here's an example of a 2-span Steel Composite I Girder Curved Bridge. The time-dependent material is the long-term modular ratio of 3n considered through the “Section Stiffness Scale Factor” & and “Effective Width Scale Factor.” If you want to check how to create this model with the wizard functionality quickly, please check this link.
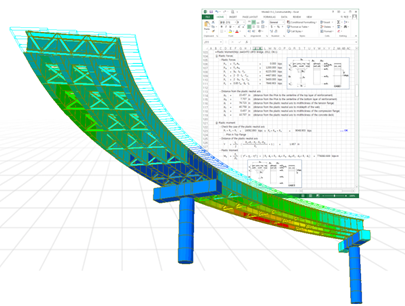
Now let’s check out the difference between the analysis result with Construction Stage Analysis and the analysis result without Construction Stage Analysis.
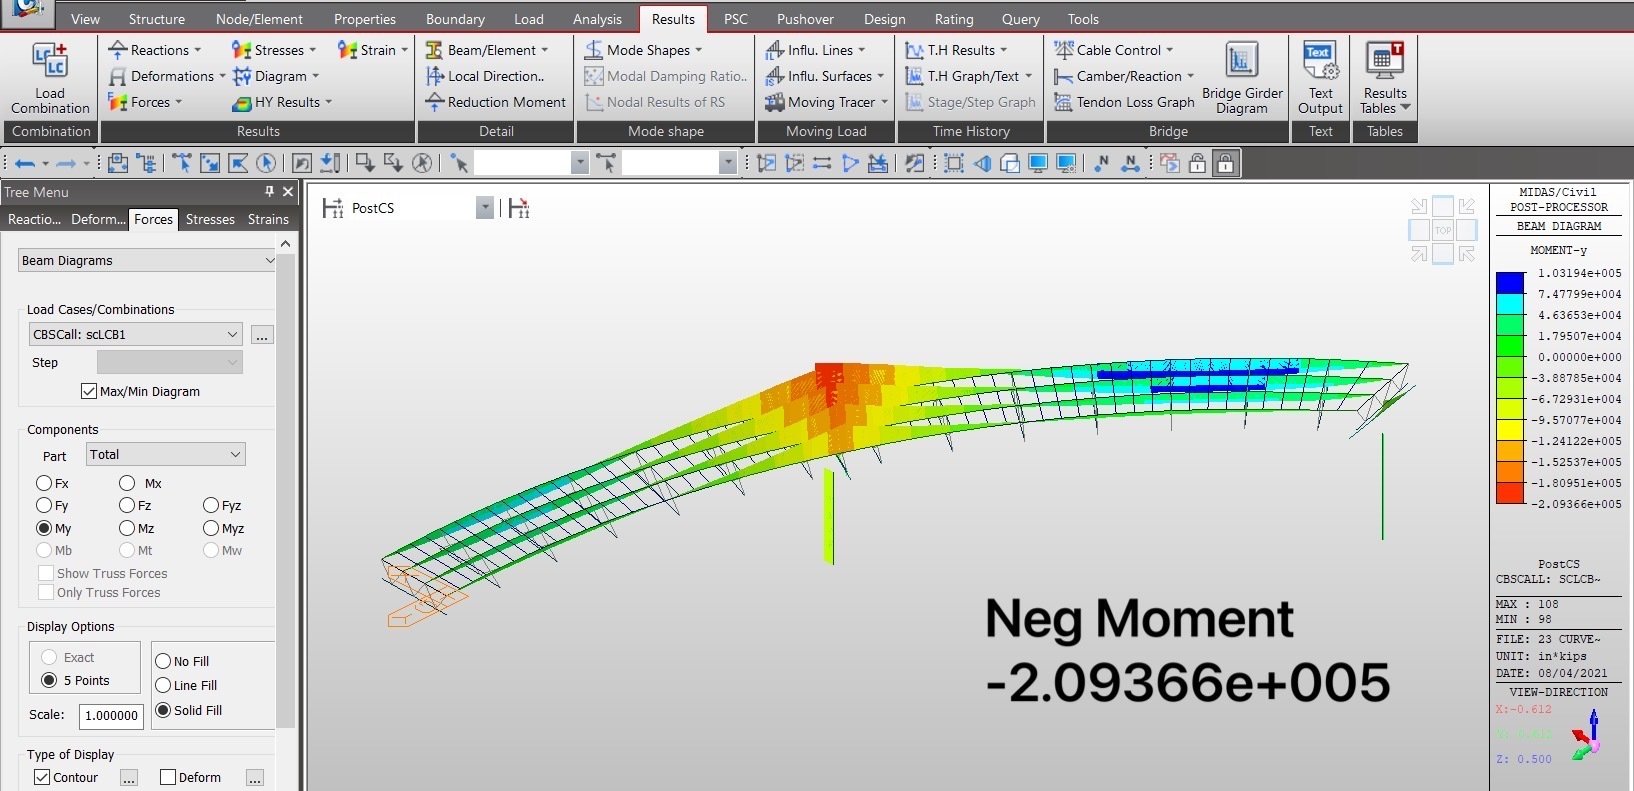
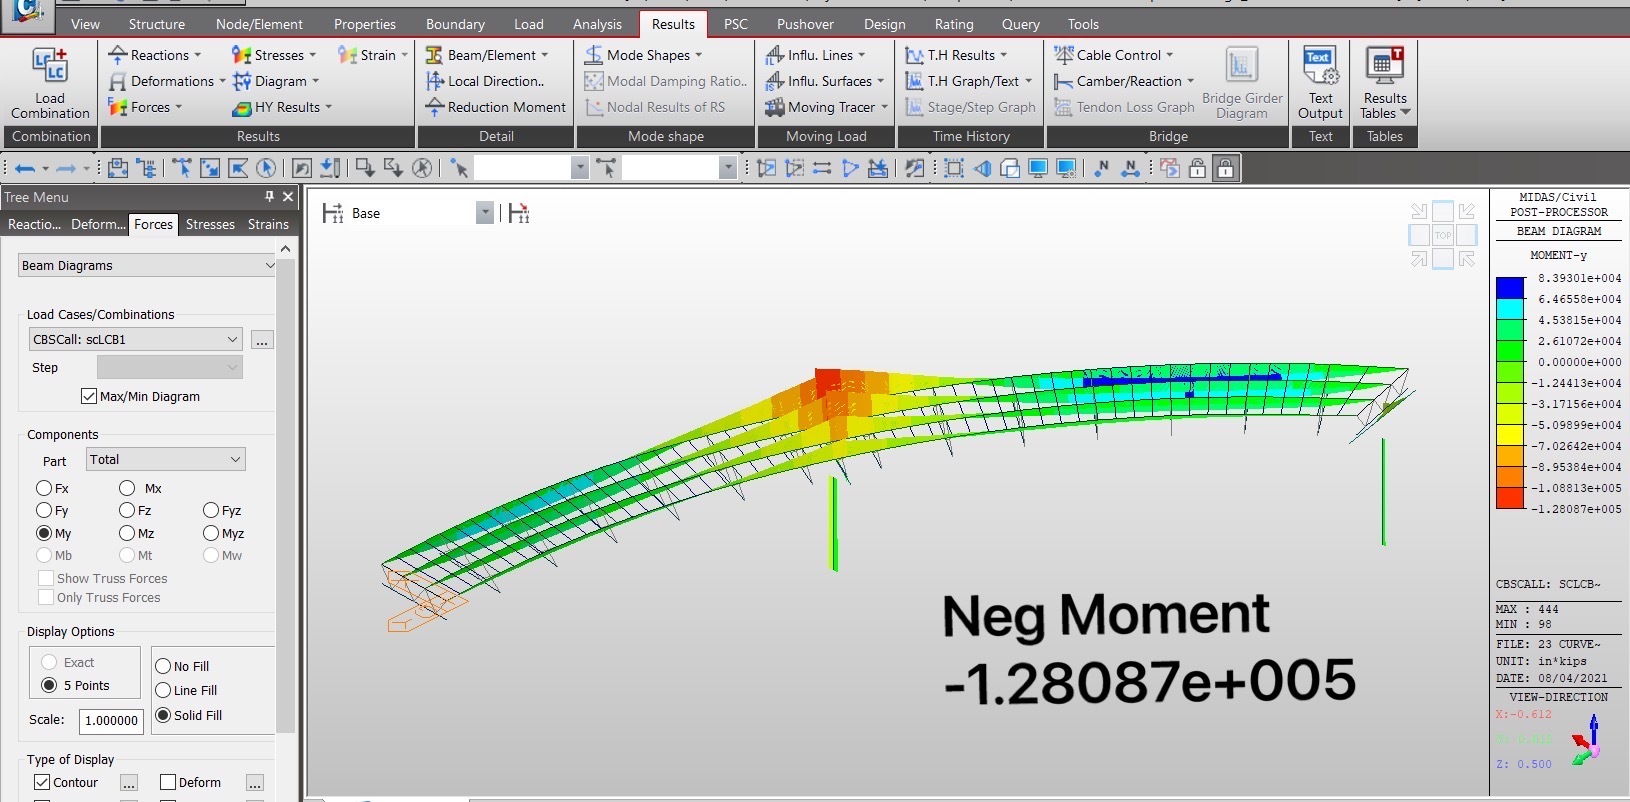
Image 1-1, with Construction Stage Analysis, Load case scLCB1

Image 1-2, without Construction Stage Analysis, Load case scLCB1
The load case CBSall: scLCB1 is selected. In the Image 1-1 model, the load case considers both dead loads and time-dependent effects. In the Image 1-2 model, the load case only considers the dead loads. Although the graphics of these two examples look similar, the analysis results are different. The value of moment-y is much bigger for the model that considers construction stage analysis.
How about the design result? The composite design results for both models are shown below. If you want to know how to run the composite design and export a transparent Excel report from midas Civil, please check this link.

Image 3-1, with Construction Stage Analysis, Design Total Checking
 Image 3-2, without Construction Stage Analysis, Design Total Checking
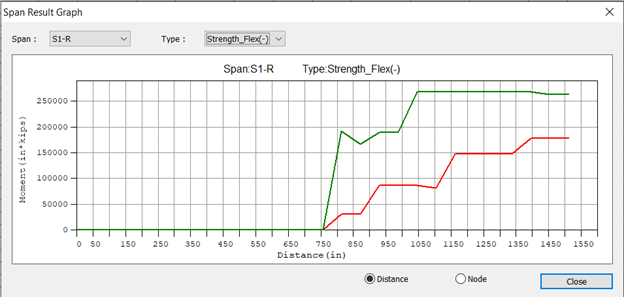
Image 3-3, with Construction Stage Analysis, Span Result Graph
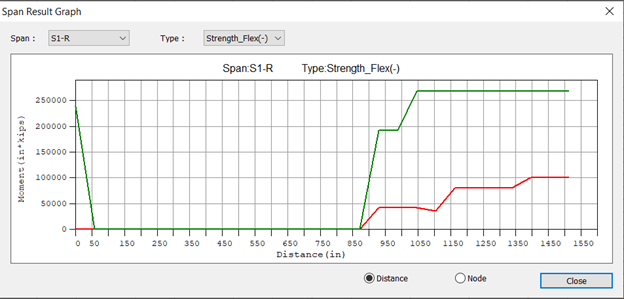
Image 3-4, without Construction Stage Analysis, Span Result Graph
If we compare images 3-1 and 3-2, you can find out that the strength limit and service limit ratios for the model with construction stage analysis is much bigger. In the Span Result Graph, the green line represents the capacity, and the red line represents the demand. If you compare images 3-3 and 3-4, you can find out that the capacity of each model is the same, but the demand of each model is different. The model with construction stage analysis has a bigger demand.
To sum up, the result will be more accurate if we consider the construction stage analysis. You may obtain an inaccurate result when using a simple design program or analysis program when the model is irregular or complex. Without the need for manual modification, midas Civil considers the time-dependent effects and long-term effects. Midas Civil can help you create a more realistic and accurate design without the need for multiple models since midas Civil can simulate the above with one single model file.


Add a Comment