This webinar shows different approaches to simulating contact in Midas FEA NX's 3D element models, various contact models, ways to define ma...

8 min read
Author: Daniel Mariscal
Publish Date: 17 May, 2021
What is Bridge Redundancy?
Bridge redundancy is the capacity of the structure to carry loads after the structure is damaged or after one of its members ruptures. The manual for Bridge Evaluation (2008) defines bridge redundancy as the “capacity of the bridge to carry loads after damage or the failure of one or more of its members”.
What are the Types of Structural Redundancy?
- Structural redundancy
Structural redundancy is defined as redundancy that exists as a result of the continuity within the load path. Any statically indeterminate structure may be said to be redundant. For example, a single span is statically determinate and cannot distribute load or stresses to another span. It is therefore nonredundant. A continuous two-span bridge has structural redundancy. A simpler way to explain this, if we have a beam that has three spans and the middle span breaks, the beam would still hold because it is still supported by the middle two supports.
- Load path redundancy
Load path redundancy refers to the number of supporting elements, usually parallel, such as girders or trusses. For example, for a bridge that has 9 I girders, if one of the girders breaks in the middle and we have the 8 other girders that can share the load from the ruptured girder
- Internal member redundancy
With internal redundancy, the failure of one element will not result in the failure of the other elements of the member. Almost like load path redundancy, internal redundancy is more intricate such that when one of the major structural elements breaks, the load can be redistributed in different ways to different members.
How Do We Define Redundancy?
Figure 1 shows the load capacity vs displacement plots of the pristine model and the damaged model of a sample bridge. We first gradually apply dead load and we then load the structure beyond the capacity of 1 and add the multiplied live load. The bridge structure starts to deform and more so until failure, and the dotted red line shows the live load capacity at rupture. The pristine structure ruptures at roughly 3 times the total live load, and the damaged model ruptures at roughly 1.3 times the live load. Using the plots in figure 1, we can measure the capacity of the structure.
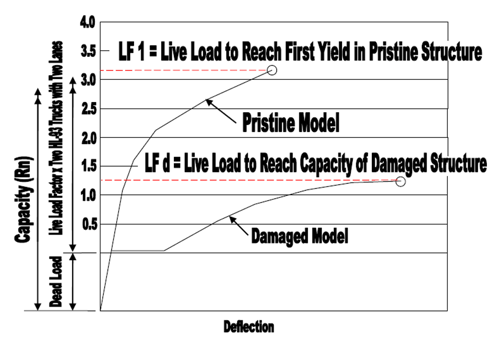
Figure 1. Load capacity vs. Deflection of the undamaged pristine model and the damaged model.
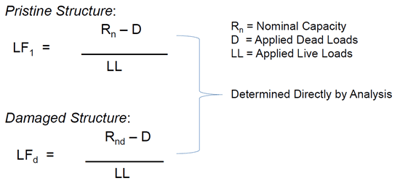
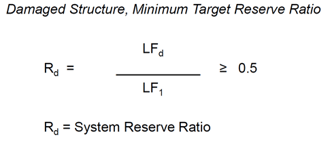
Therefore, when we look at bridge redundancy from the two plots in figure 1, we have the following parameters, LF1 and LFd. Similar to the load rating factors, the two parameters tell us the reserve capacity of the structure to resist the live load, with LF1 for the pristine structure and LFd for the damaged structure. LF1 and LFd can also be expressed as functions shown below:
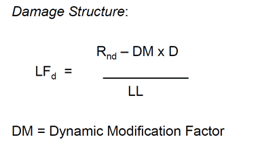
To consider the dynamic effect of the damaged structure when the beam breaks and snaps, we add the dynamic effect to the dead load before we find the damaged structure factor.
Once we determine the above two parameters LF1 and LFd, we divide the two to get Rd the system reserve ratio. If Rd is greater than 0.5, then we can define the structure as a redundant structure.
Why is Structural Redundancy Important?
- System Redundant Member
AASHTO LRFD 2017 defines a system redundant member as: “a steel primary member or portion thereof subject to tension for which the redundancy is not known by engineering judgment, but which is demonstrated to have redundancy through a refined analysis”. Meaning that a refined analysis is needed to find out if a member is part of a redundant system.
- Fracture Critical Member
AASHTO LRFD 2017 defines a Fracture Critical Member as “a steel primary member or portion thereof subject to tension whose failure would probably cause a portion of the entire bridge to collapse”. When designing a bridge, we need to know which are the fracture critical members because special members would need to be given special considerations, including special design considerations, special fabrication considerations, and special maintenance considerations.
Per AASHTO LRFD 2017, "an SRM (system redundant member) need not be subject to the hands-on in-service inspection protocol for an FCM (fracture critical member) as described in 23 CFR 650". Therefore, determining a structural member as SRM would save a considerable amount of time and effort.
Past Project Application: Redundancy Evaluation for Twin Steel Box Girder Bridges
This example shows the redundancy evaluation of a sample bridge. The bridge has been designed as a fracture critical member, and therefore demonstrating its redundancy will involve in-depth structural analysis and may require enhancement to certain structural details. The benefit is that structures, if proven redundant, can be maintained as non-fracture critical, and the cost and effort will be reduced.
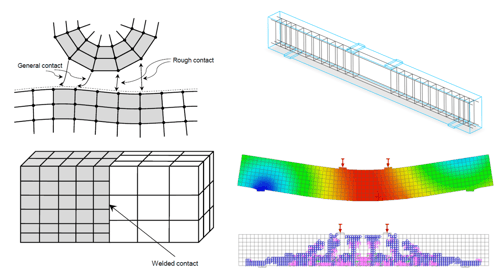
To accomplish the complex modeling and analysis necessary in this study, advanced modeling software with nonlinear capabilities was required. After considering several advanced finite element-based structural programs, Midas FEA (now Midas FEA NX) was selected due to its nonlinear capabilities, construction stage analysis options (necessary to simulate sequential stress activation), ability to simulate shear studs using interface elements, and various ways to evaluate convergence for nonlinear analysis (multiple iterations and convergence schemes, Newton-Raphson, Arc-length, displacement norm, energy norm, etc.).
The methodology used to determine the redundancy status of the analyzed structure, shown in figure 2, was as follows:
- A non-linear advanced structural model is developed. This model uses the best estimate for material responses without applying strength reduction factors. Loads are estimated without applying load factors.
- A set of unfactored 2x HL-93 loads multiplied by LFd are positioned laterally and longitudinally to produce the most critical effect. (We determine which location of the bridge is the most critical and has the highest possibility of fracturing, which usually is the location of the maximum positive moment and at the end spans. And we analyze the internal state resulted from the dead and live load multiplied by the dynamic factors and then we increase the live load till failure).
- The damaged element under consideration was fully severed creating a complete separation between fracture planes at the point under consideration.
- The internal stress state due to dead and live loads, multiplied by a dynamic effect factor, is incrementally applied to the non-linear structural system.
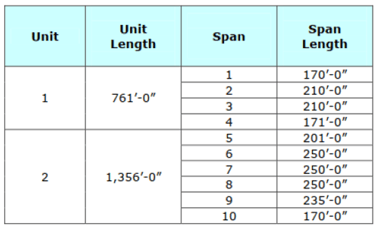
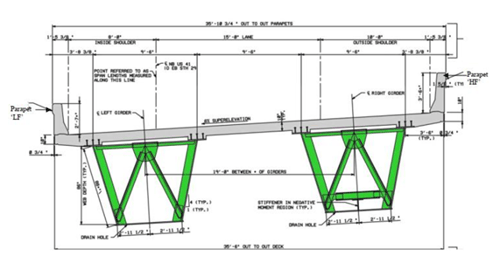
Figure 2. The span information and the cross-section geometry of the analyzed twin steel box girder bridge.
Mesh and Nonlinear Material Properties
For the redundancy analysis, originally, we have thought of using the brick elements for the deck. It would create a gigantic model whose run time would be extremely long. Eventually, we have decided to use the plate elements after we have run tests to make sure that the reinforcement can be modeled in the plate element model. And the total concrete strain model can be used in the Midas FEA plate model as well. Furthermore, the shear stud is an important part of the equation of redundancy. Because as the girder breaks it pulls on the deck. As it does that the load goes from the girder to the shear studs to the deck, and from the deck to the other girders that would be helping with the redundancy. We had to make sure the shear studs have the pull-out capacity and some degree of shear capacity. Meanwhile, we also need to find out the dynamic effect of the structure associated with its rupture. Therefore, there's not only the load in the beam that gets transferred to the other part of the structure but also a dynamic effect to the structure.
Figure 3 to 5 shows the nonlinear material models used for the analysis:
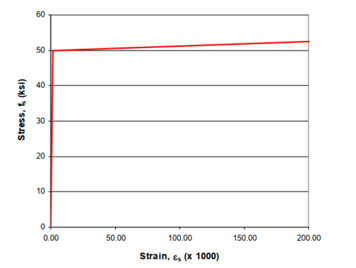
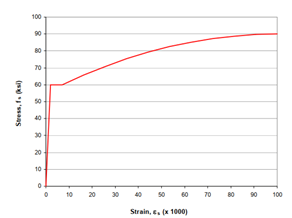
Figure 3. (Left) Linear elastic with soft strain hardening for the steel box nonlinear properties.
Figure 4. (Right) Linear elastic with strain hardening for the rebar nonlinear properties.
%20and%20tension%20(exponential%20model)%20for%20the%20concrete%20nonlinear%20properties-png-1.png?width=570&name=Compression%20(Thorenfeldt%20model)%20and%20tension%20(exponential%20model)%20for%20the%20concrete%20nonlinear%20properties-png-1.png)
Figure 5. Compression (Thorenfeldt model) and tension (exponential model) for the concrete nonlinear properties.
Figure 6 to 9 shows the different element types assigned to the bridge structure:
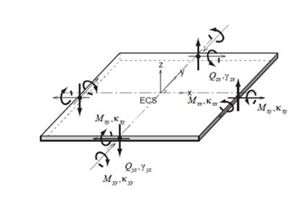
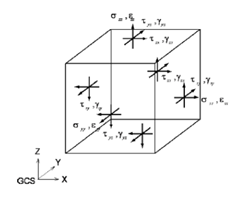
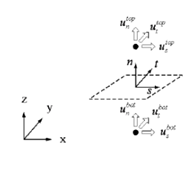
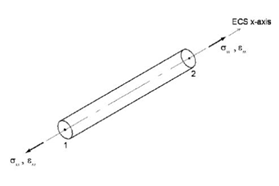
Figure 6. (Top Left) 4 node shell elements used for steel box girders and diaphragms.
Figure 7. (Top Right) 8 node hexahedron solid elements used for the parapets.
Figure 8. (Bottom Left) Point interface elements used for the shear studs.
Figure 9. (Bottom Right) 2-node 3D truss elements used for the bracing members.
Figure 10 shows the geometry lines that are used to define the geometry. The blue lines represent the reinforcement lines. Midas then convert them to finite element members.
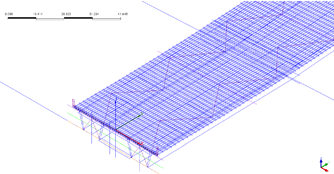
Figure 10. Reinforcement lines in Midas FEA.
Figure 11 shows the meshed bridge model. In which the parapets are meshed using solid elements, the deck and web using shell elements, and the shear studs using interface elements on top of the web.
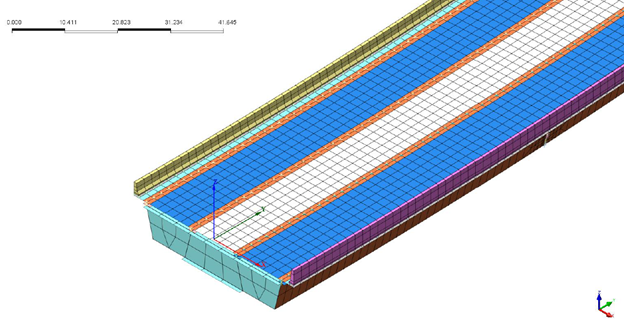
Figure 11. The meshed bridge model, with the parapet meshed using solid elements, the deck and web using shell elements, and the shear studs using interface elements on top of the web.
Figure 12 shows the model with reinforcement modeled as truss elements. Once modeled using truss elements, the program recognizes the reinforcement embedded within the concrete deck and thus carrying the same displacement information. Figure 13 shows the bracings modeled with truss elements and diaphragms with plate elements. Figure 14 shows how the parapet solid elements are connected with the deck plate elements using the rigid links.
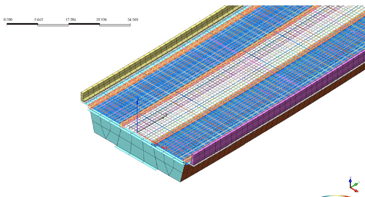
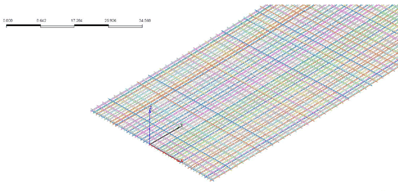
Figure 12. Bridge model with reinforcement meshed using truss elements in Midas FEA.
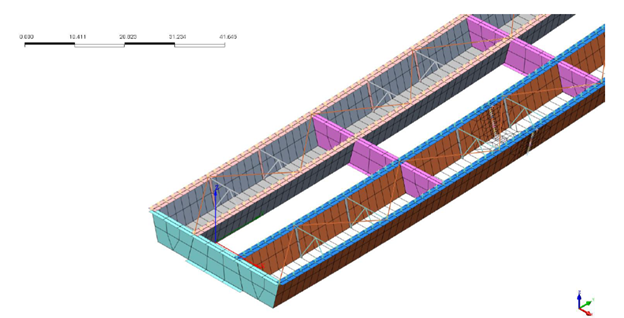
Figure 13. Bracings modeled with truss elements and diaphragms with plate elements.
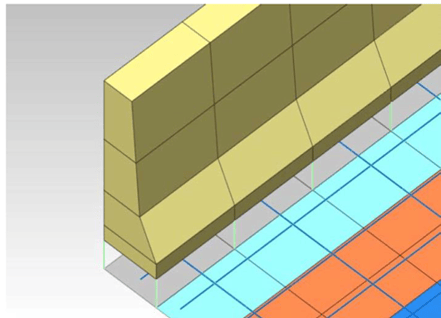
Figure 14. The parapet solid elements are connected with the deck plate element using the rigid link.
Fracture Modeling
Fracture location is selected to be where the maximum positive moment occurs. Figure 15 and 16 shows the side view and the isometric view of the fracture modeled in the shell model. The fracture has 17 nodes at the side and bottom of the flange. The fracture is defined such that there are two nodes at the same space, one belongs to the left side of the girder and the other belongs to the right side of the girder, and is connected using the infinitely rigid springs.
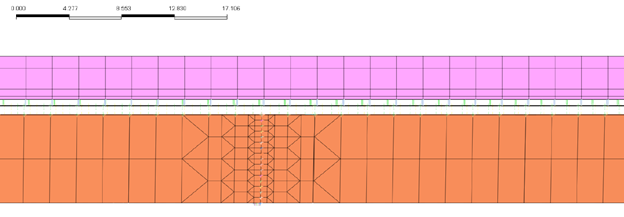
Figure 15. Side view of the fracture
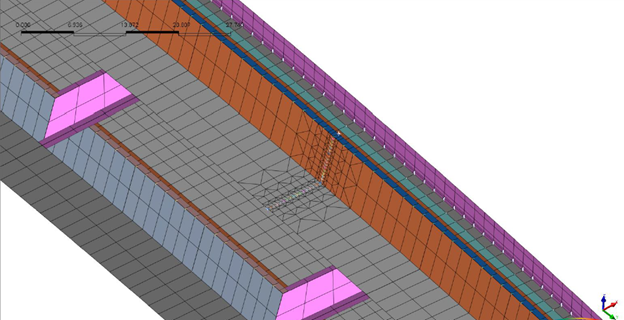
Figure 16. The fracture modeled at the bottom of the flange.
To mimic the progressive failure, we start unbuttoning the fracture from the middle by removing the rigid spring at the middle and work our way towards the webs of both sides. When we get to the webs we remove the springs from the bottom until all the springs are removed. Therefore, this simulates a progressive failure instead of a one-step failure.
This sequential "unbuttoning" was utilized using the construction stage analysis in Mida FEA. This functionality not only allows for the activation/deactivation of load groups but also the geometry, boundary conditions, etc. In this case, the activation/deactivation of the rigid springs. We created 24 construction stages to deactivate the rigid springs one by one to simulate the progressive failure.
Live Load Application
Figure 17 shows the application of 2 HL-93 design trucks on the structural critical member (Left), and the application of the HL-93 lane load (Right).
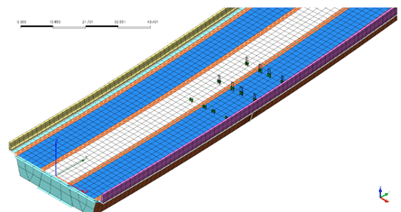
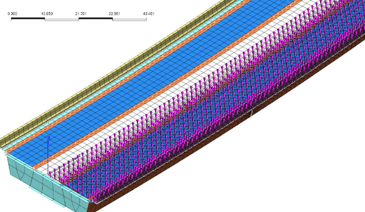 Figure 17. The application of 2 HL-93 design trucks on the structural critical member (Left), and the application of the HL-93 lane load (Right).
Selected Result Plots
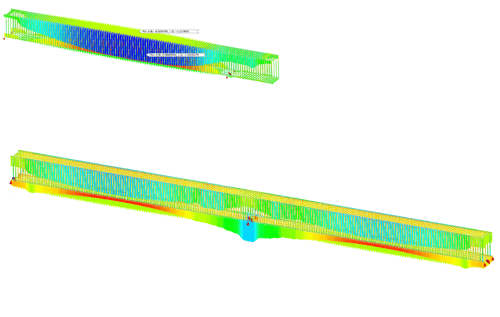
Figure 18 and 19 are the displacement contour, with the maximum girder deflection being 31.8 in and the steel fracture clearly visible in both figures. In figure 19, the top flange and deck separation is visible. The delamination is caused by the shear studs' pull-out capacity, with it gradually decreases when moving along at either side of the fracture. The delamination eventually disappears as the shear studs are able to pick up the connections again.
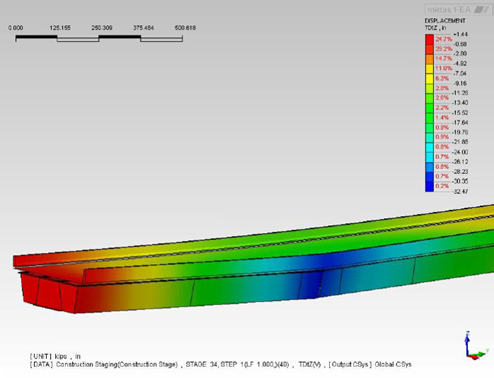
Figure 18. Maximum Girder deflection 31.8in, girder fracture shown as the opening in the results plot.
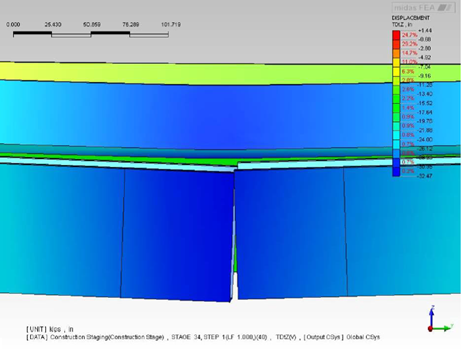 Figure 19. Top flange/deck separation.
Figure 20 shows the stress contour (maximum tensile stress occurs at mid-span on the left girder). This is because when the right girders fracture (fracture shown in the figure), the left girder stresses go up because it starts to take the stress that the right girder used to take.
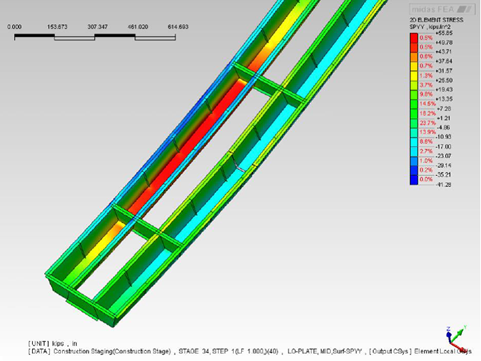
Figure 20. Stress contour of the girders with the fracture shown on the right girder.
Figure 21 shows the stress at the top (Left) and bottom (Right) fiber of the deck. When using shell elements, Midas FEA allows for plotting out the top and bottom stresses. So what we can see is that the maximum compressive stress is about 2800 psi, which is the rupture strength of the concrete. This is because due to the fracture of the steel member, the concrete is taking the majority of the load. And similarly, the bottom fiber on the left of the deck is now taking more compressive loads due to the fracture of the girder on the right side.
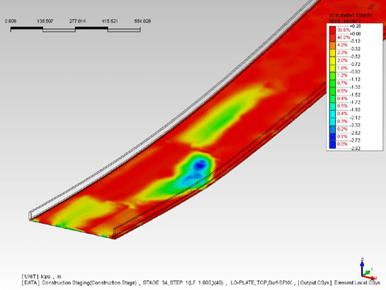
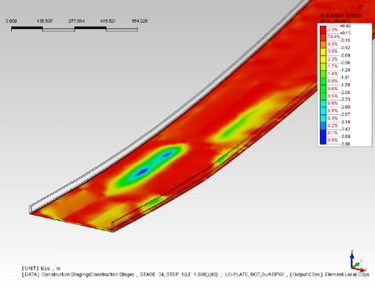
Figure 21. Stress at the top and bottom fiber of the deck.
Figure 22 shows the crack status of the top (Left) and bottom (Right) fiber of the deck shell element. The blue color represents partially opened cracks during loading, the purple color represents partially opened cracks during unloading, the red color represents fully opened cracks during loading, and the orange color represents fully opened cracks during unloading. It shows that the left side of the deck did not crack at the bottom while the right side of the bottom deck has cracked extensively.
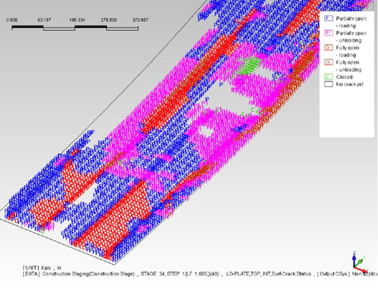
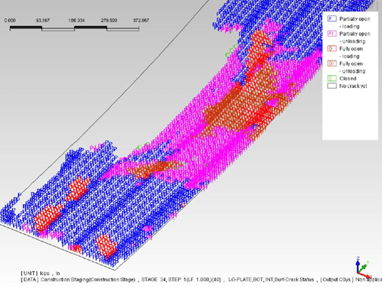
Figure 22. Crack status of the top and bottom fiber of the shell elements of the deck.
Figure 23 shows the deck reinforcement stress at the top layer. Due to the fracture on the right girder, the left side of the bridge is now essentially holding the entire bridge. Therefore, the stresses on these reinforcements have gone up.
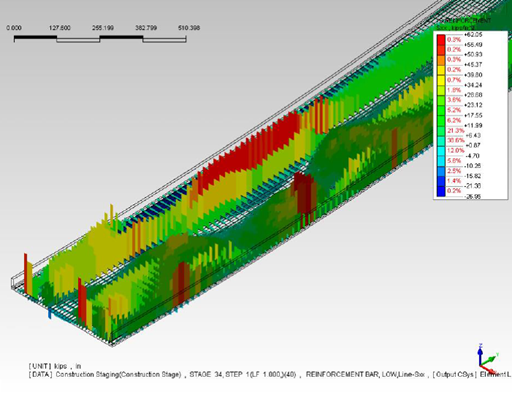 Figure 23. Deck reinforcement stresses - top layer.
Figure 24 shows the stresses on the 3D parapets elements. Concentrated tensile stress is observed on the right parapet because the right girder is breaking and hence the parapet is dropping.
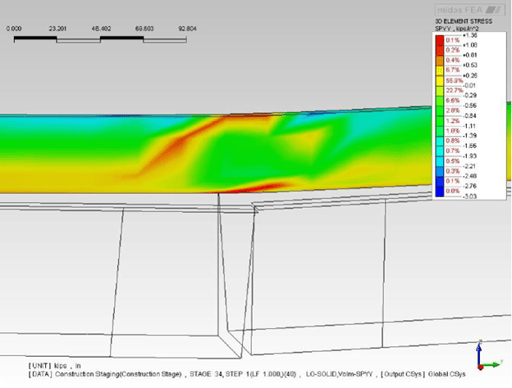
Figure 24. Stress plot of the 3D elements representing the parapets.
Inspection of the results from model run Rd = 0.7 indicates that the intact girder top flange will reach the buckling stress limit of 50 ksi for a redundancy factor of Rd=0.7. A plot of maximum girder deflection versus system reserve ratio, shown in figure 25, also suggests that for ratios greater than Rd = 0.75, the bridge structure will lose the ability to resist further loads. Therefore, based on this redundancy analysis, the system reserve ratio for the said structure is quantified as Rd = 0.70. As written previously, when Rd is bigger than 0.5 the structure is deemed redundant.
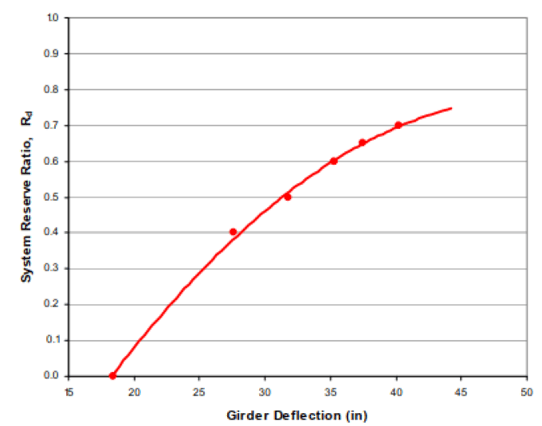
Figure 25. The plot of the system reserve ratio Rd against girder deflection.
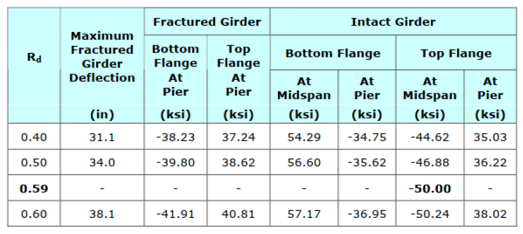
Figure 26. Stress in different structural elements when the Rd factor increases.
Editor: JC Sun
Add a Comment